KLA Beat Across the Board: Process Control Dominance Intact, Advanced Packaging Surges 57%
KLAC Q3 FY2026 Earnings Update | May 31, 2026

KLA Beat Across the Board: Process Control Dominance Intact
Earnings Summary
Key Takeaways
Results beat on strong Semiconductor Process Control and Services demand
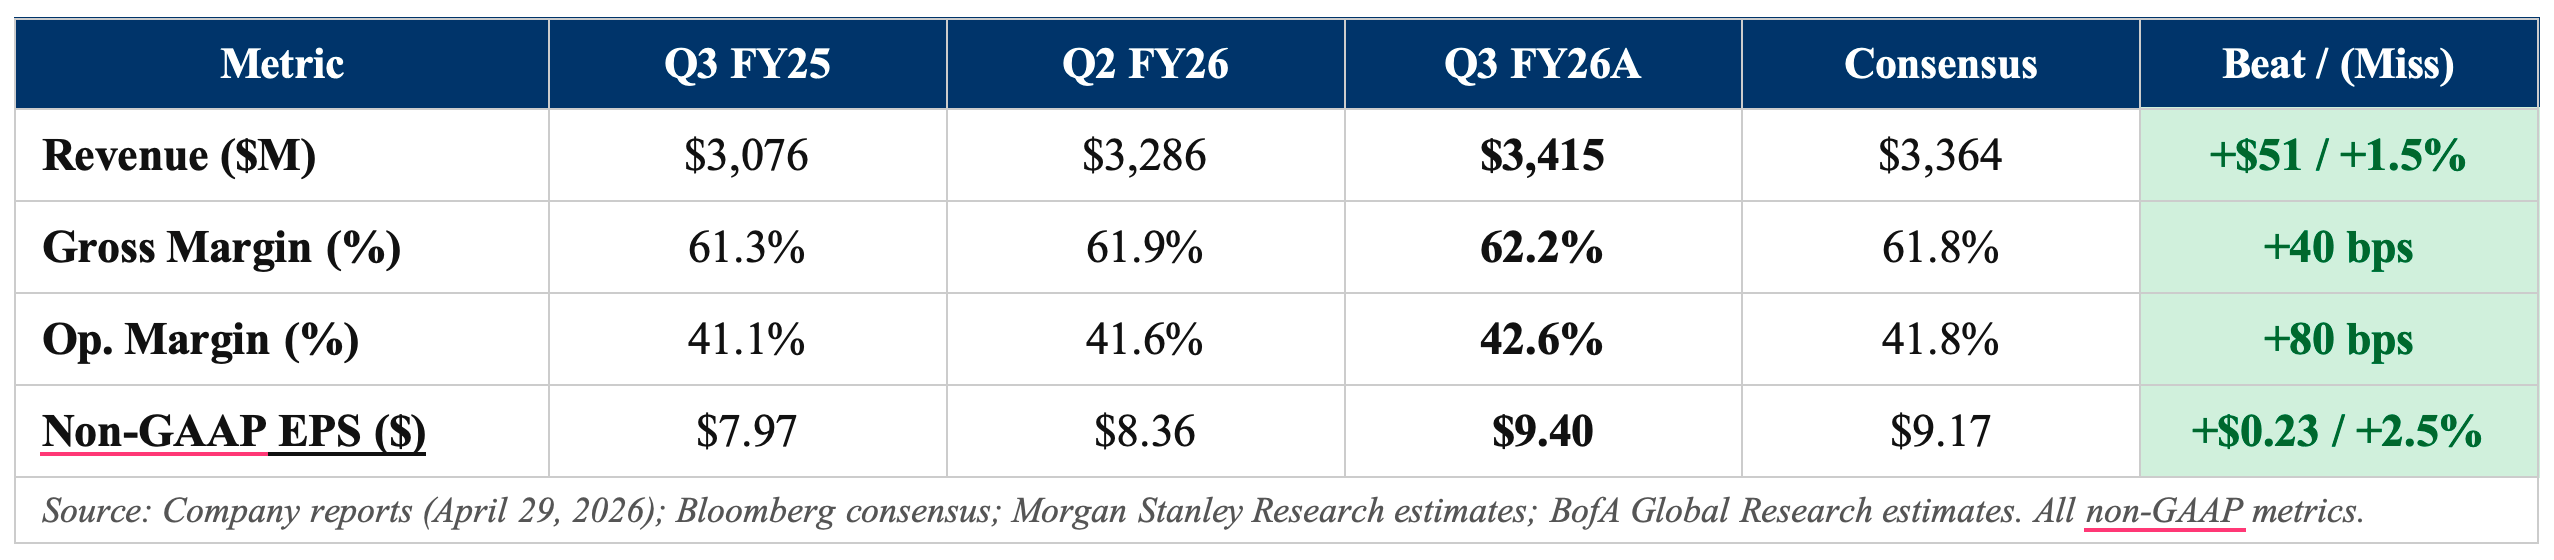
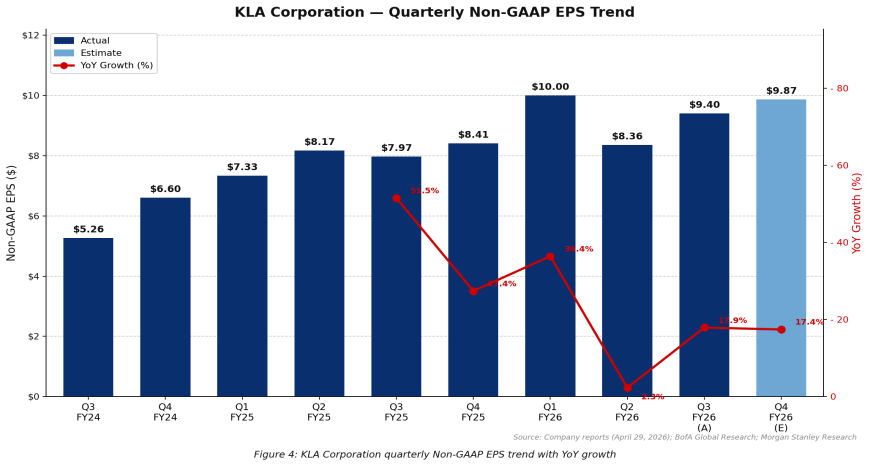
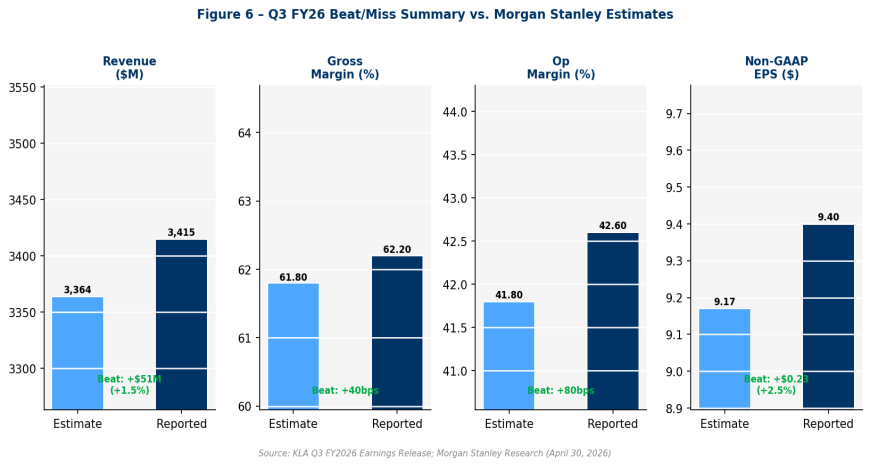
Q3 FY26 revenue of $3,415M beat our estimate of $3,364M by $51M (+1.5%) on broad-based strength across wafer inspection and services. Non-GAAP EPS of $9.40 exceeded consensus of $9.17 by $0.23 (+2.5%), driven by upside revenue leverage and gross margin expansion of +90bps YoY to 62.2%.
WFE outlook upgraded to $140B+ for CY26; 2027 outlook also raised
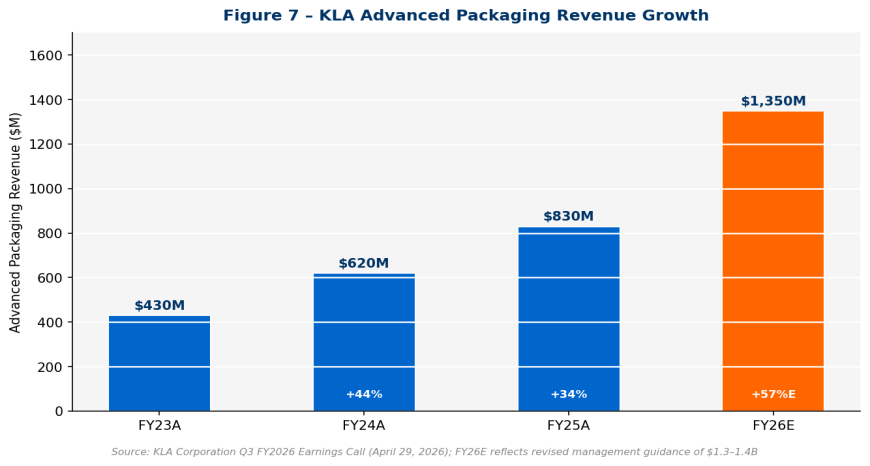
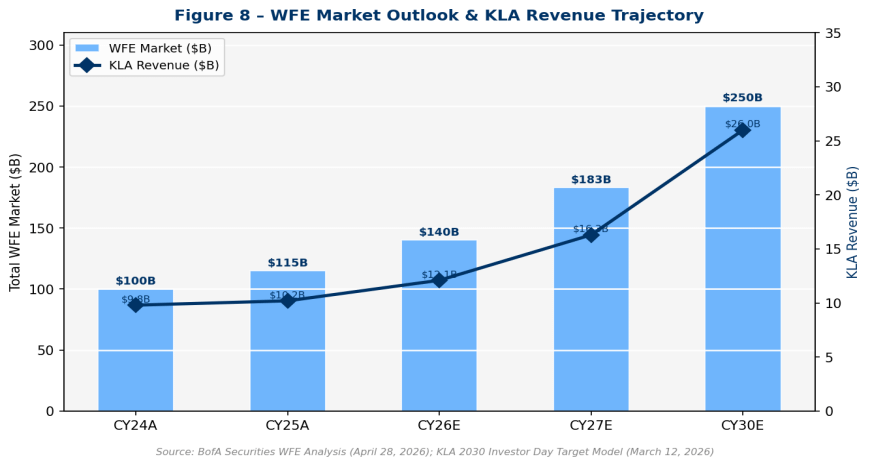
Management raised its CY2026 WFE outlook to ‘over $140 billion’ from the prior ‘$130B+’ range. More significantly, KLA now expects CY2027 WFE growth to be ‘higher than 2026,’ implying $160B+ — well above prior consensus of ~$150B. Advanced Packaging revenue guidance raised to $1.3-1.4B for FY26, representing ~57% growth, driven by gate-all-around inspection wins.
China revenue stable at 24%; manageable near-term risk
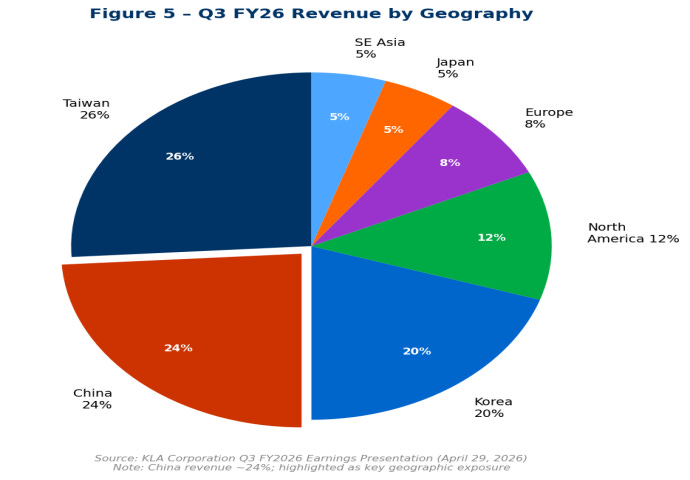
China contributed 24% of revenue (~$820M) in Q3 FY26, in line with prior quarters. Management characterized demand as ‘broad-based’ across domestic chipmakers, with no material disruption from ongoing BIS export controls. We continue to monitor this exposure closely as the BIS compliance environment evolves.
Maintaining Overweight with $2,200 Price Target; premium justified by 2030 earnings power
Our $2,200 price target implies 21.1% upside from current levels. At $84 EPS in FY2030 (per Investor Day target model), the stock currently trades at just 21.6x our FY2030 EPS — a compelling entry point for a structural process-control leader with 58% market share and multi-year WFE tailwinds. We view the near-term pullback as a buying opportunity.
DETAILED RESULTS ANALYSIS
Revenue Analysis — Q3 FY26
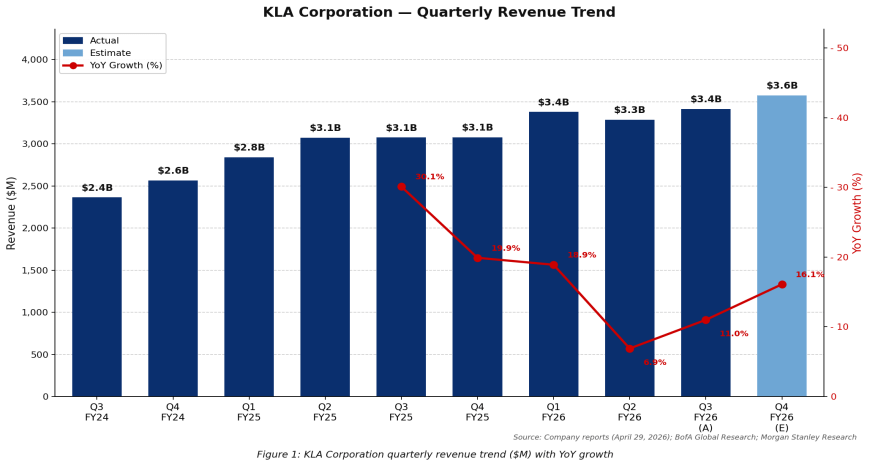
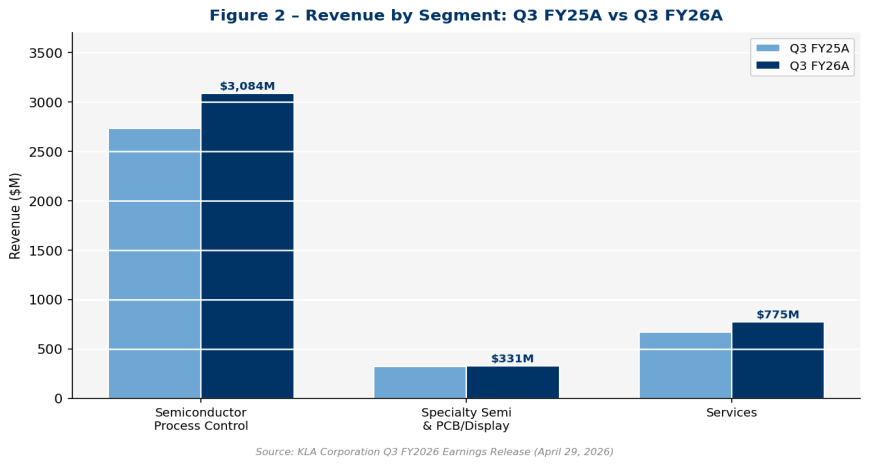
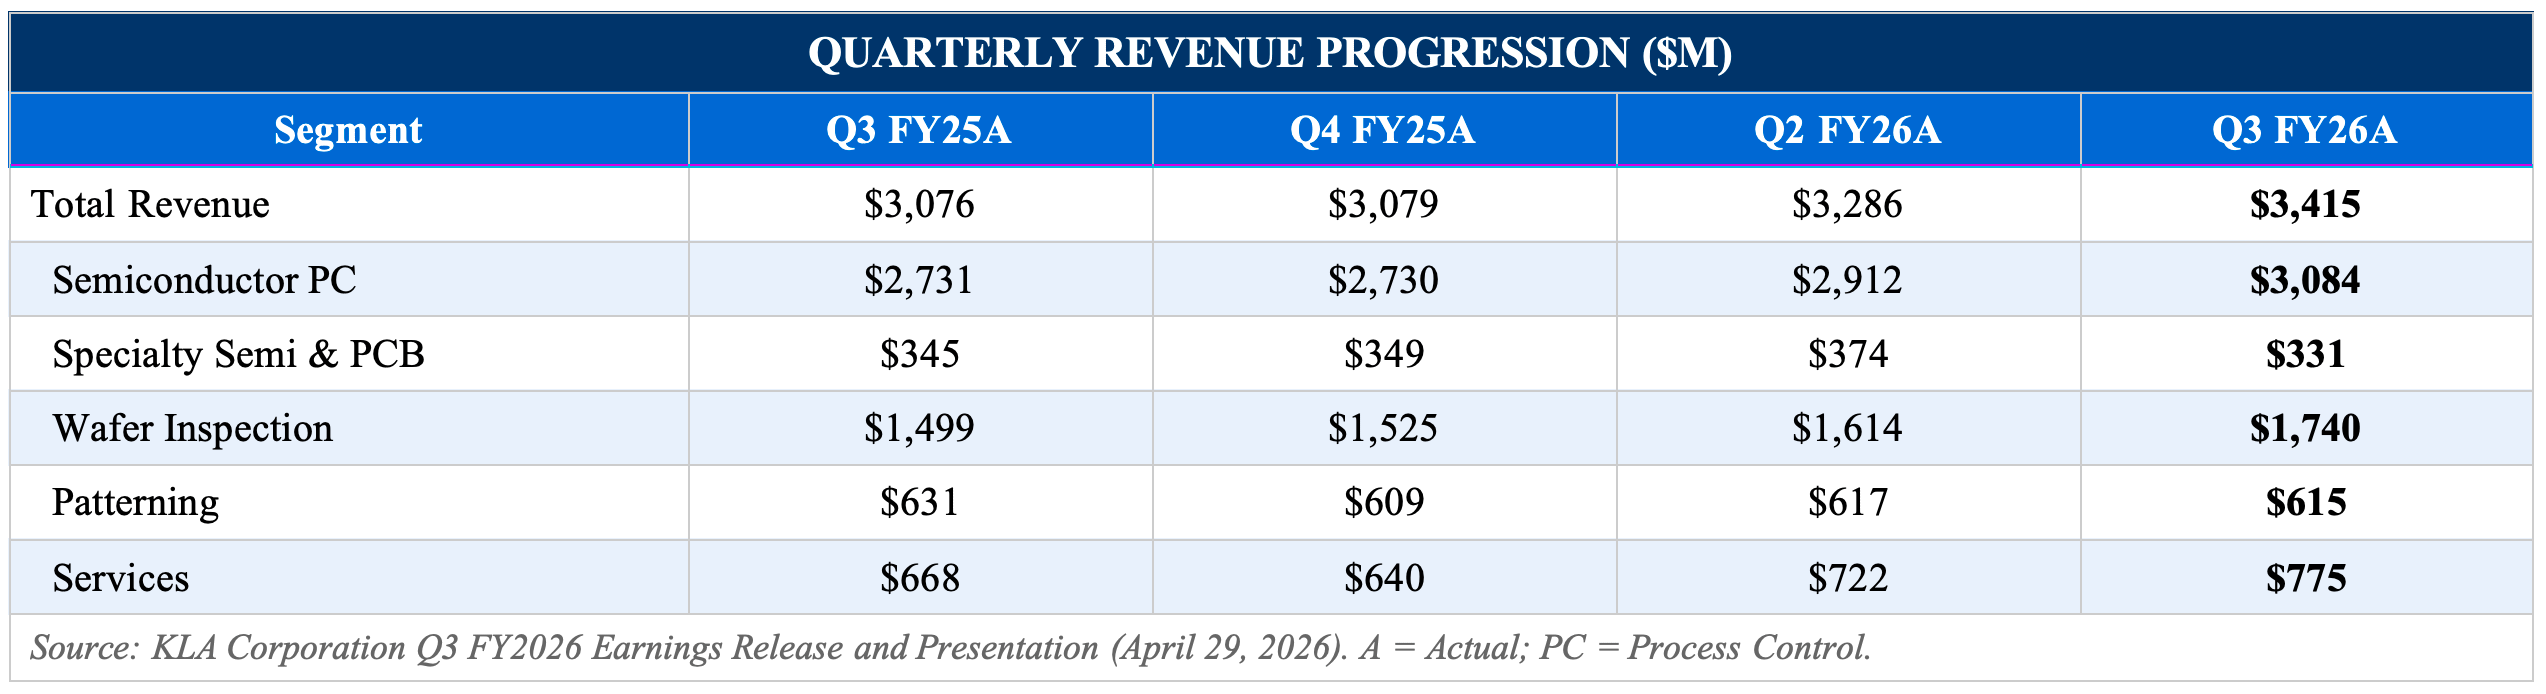
KLA reported Q3 FY26 revenue of $3,415M, representing growth of +11.0% year-over-year and +3.9% sequentially. The result exceeded our Morgan Stanley-derived estimate of $3,364M by $51M. Semiconductor Process Control (SPC) — KLA’s dominant segment at ~90% of product revenue — grew +13% YoY to $3,084M, while Services grew +16% YoY to $775M, reflecting strong installed base monetization. Wafer inspection was the standout product category, growing +16% YoY to $1,740M on accelerating gate-all-around node transitions at leading-edge fabs in Taiwan and Korea.
Patterning revenue was the lone soft spot, down -3% YoY to $615M, reflecting customer digestion of prior EUV-related orders. Management expressed confidence in a Patterning recovery in the second half of calendar 2026 as DRAM 1c/1d transitions accelerate and EUV adoption deepens at TSMC N2 and Samsung S3 nodes. Specialty Semiconductor (PCB/Display) was broadly stable at $331M.
Profitability Analysis — Q3 FY26
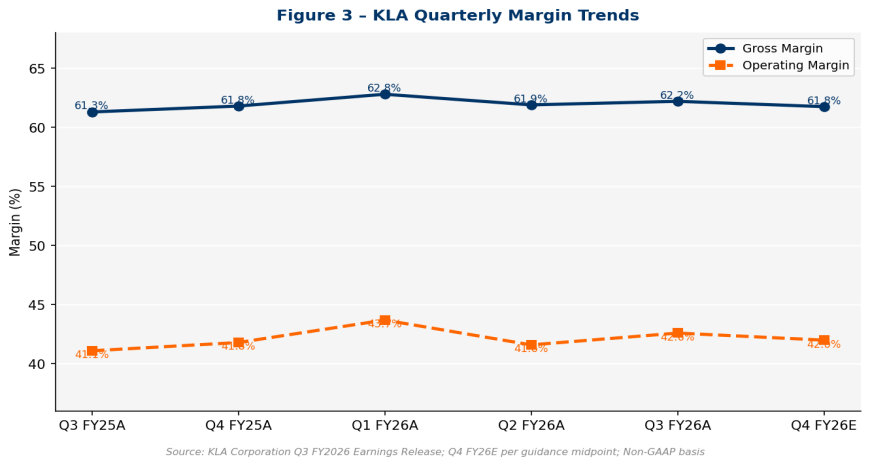
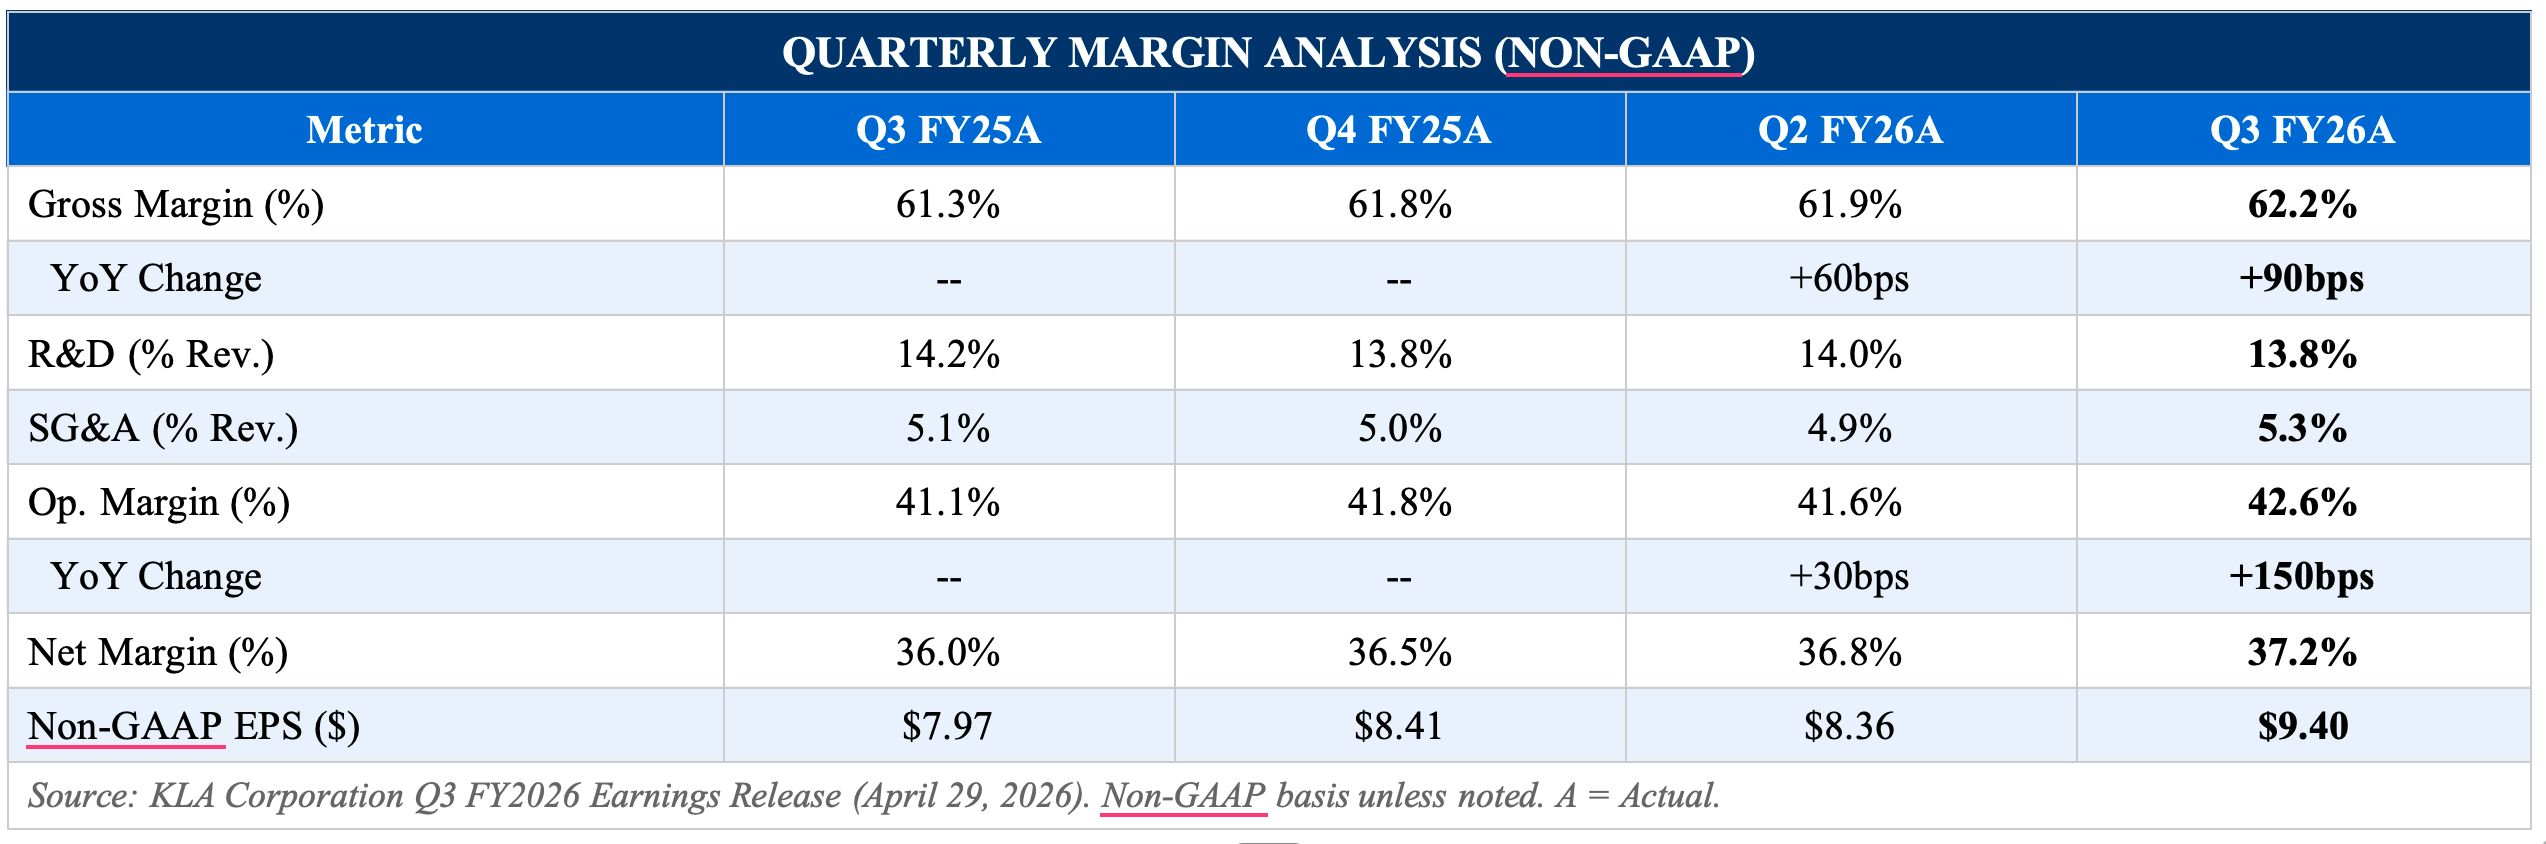
Non-GAAP gross margin of 62.2% improved +90bps YoY and +30bps sequentially, exceeding our 61.8% estimate by 40bps. Margin expansion was driven by three factors: (1) favorable revenue mix skewed toward higher-margin wafer inspection and services, (2) manufacturing efficiencies across optical and e-beam systems, and (3) continued pricing discipline in an environment of constrained specialized metrology capacity. R&D expense was 13.8% of revenue (flat YoY), and SG&A was 5.3% (up modestly due to Investor Day spend). Non-GAAP operating margin reached 42.6% — the highest level since Q1 FY26 — expanding +150bps YoY.
Non-GAAP EPS of $9.40 (+18% YoY) benefited from revenue leverage, modest share count reduction from buybacks, and a slightly favorable tax rate (~13.5% non-GAAP). GAAP EPS of $9.12 included $43M in stock-based compensation and $25M of amortization. Free cash flow of $622M in the quarter (18% margin) brings LTM FCF to $4.0B (31% FCF margin) — a key investor showcase metric.
KEY METRICS & GUIDANCE
Geographic Revenue & China Exposure
Taiwan remained the largest geography at 26% of revenue (~$887M), reflecting continued TSMC capacity ramp at 3nm and N2 nodes. China contributed 24% (~$820M) — unchanged sequentially, with demand described as ‘broad-based’ across domestic NAND, DRAM, and logic fabs. Korea at 20% (~$683M) reflects SK Hynix HBM DRAM strength and Samsung advanced logic. North America at 12% is primarily Intel’s Arizona and Ohio fabs, along with domestic DRAM players.
We note that China revenue of ~24% is a manageable exposure level. However, BIS incremental export control risk — specifically around non-leading-edge process control tools — remains the primary near-term overhang. Management affirmed that KLA’s current product portfolio is largely compliant with existing export regulations, and that any potential incremental restrictions would likely be phased with adaptation time. We estimate a scenario where China drops to ~15% of revenue would reduce our FY27E EPS by approximately $6-8/share — manageable given the WFE upcycle offsetting capacity.
Q4 FY26 Guidance — Above Street Expectations
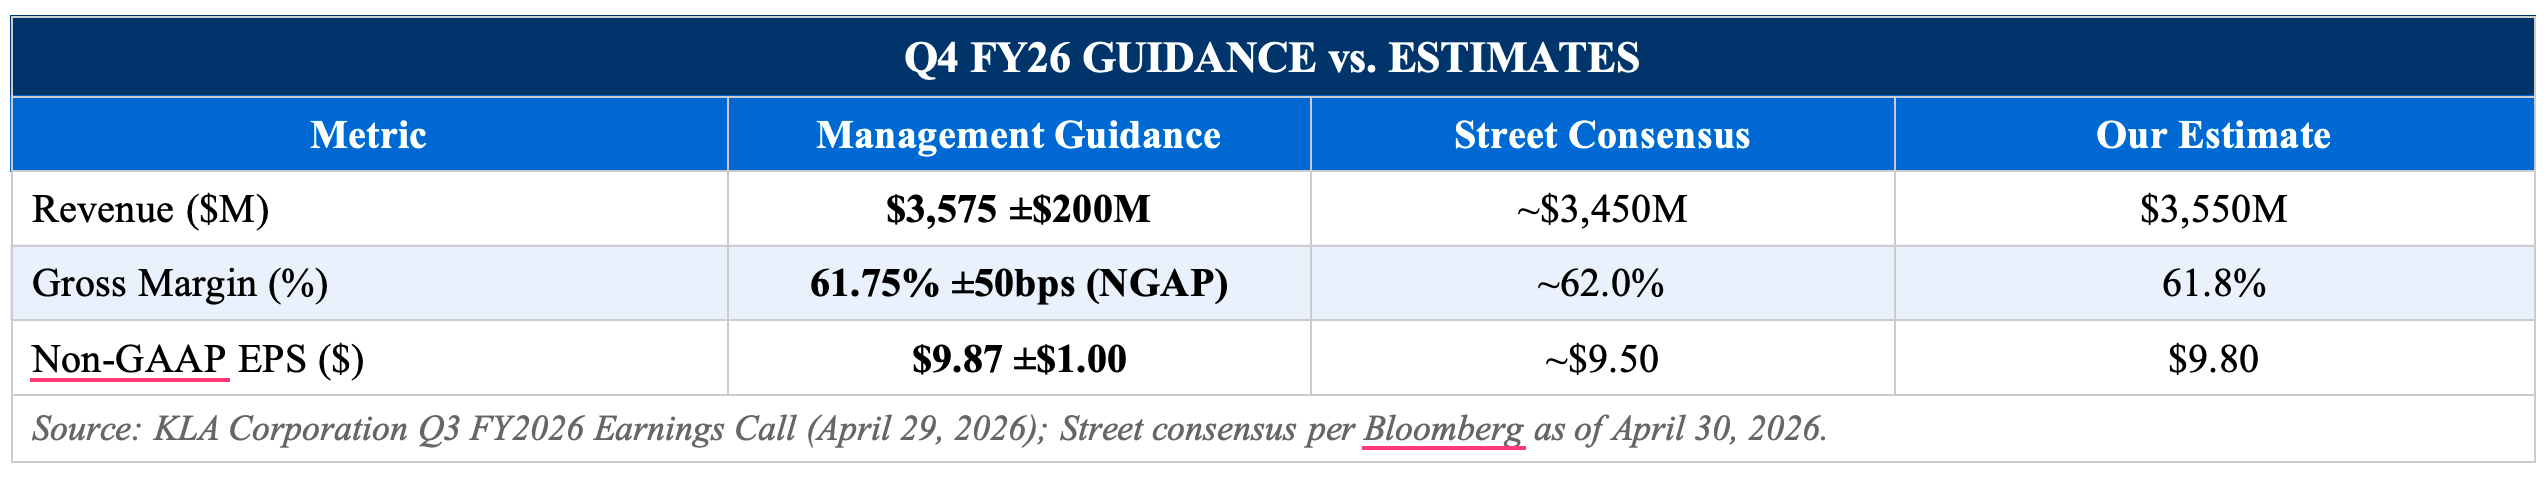
Management provided Q4 FY26 guidance of revenue $3,575M ±$200M, Non-GAAP gross margin 61.75% ±50bps, and Non-GAAP EPS $9.87 ±$1.00. The revenue midpoint of $3,575M is above Bloomberg consensus of ~$3,450M and implies continued sequential momentum (+4.7%). The guidance reflects higher services revenue and expected Advanced Packaging system deliveries skewed toward Q4. The gross margin guidance of 61.75% is below Q3’s 62.2% due to anticipated product mix normalization and some customer-specific qualification costs on new inspection platforms.
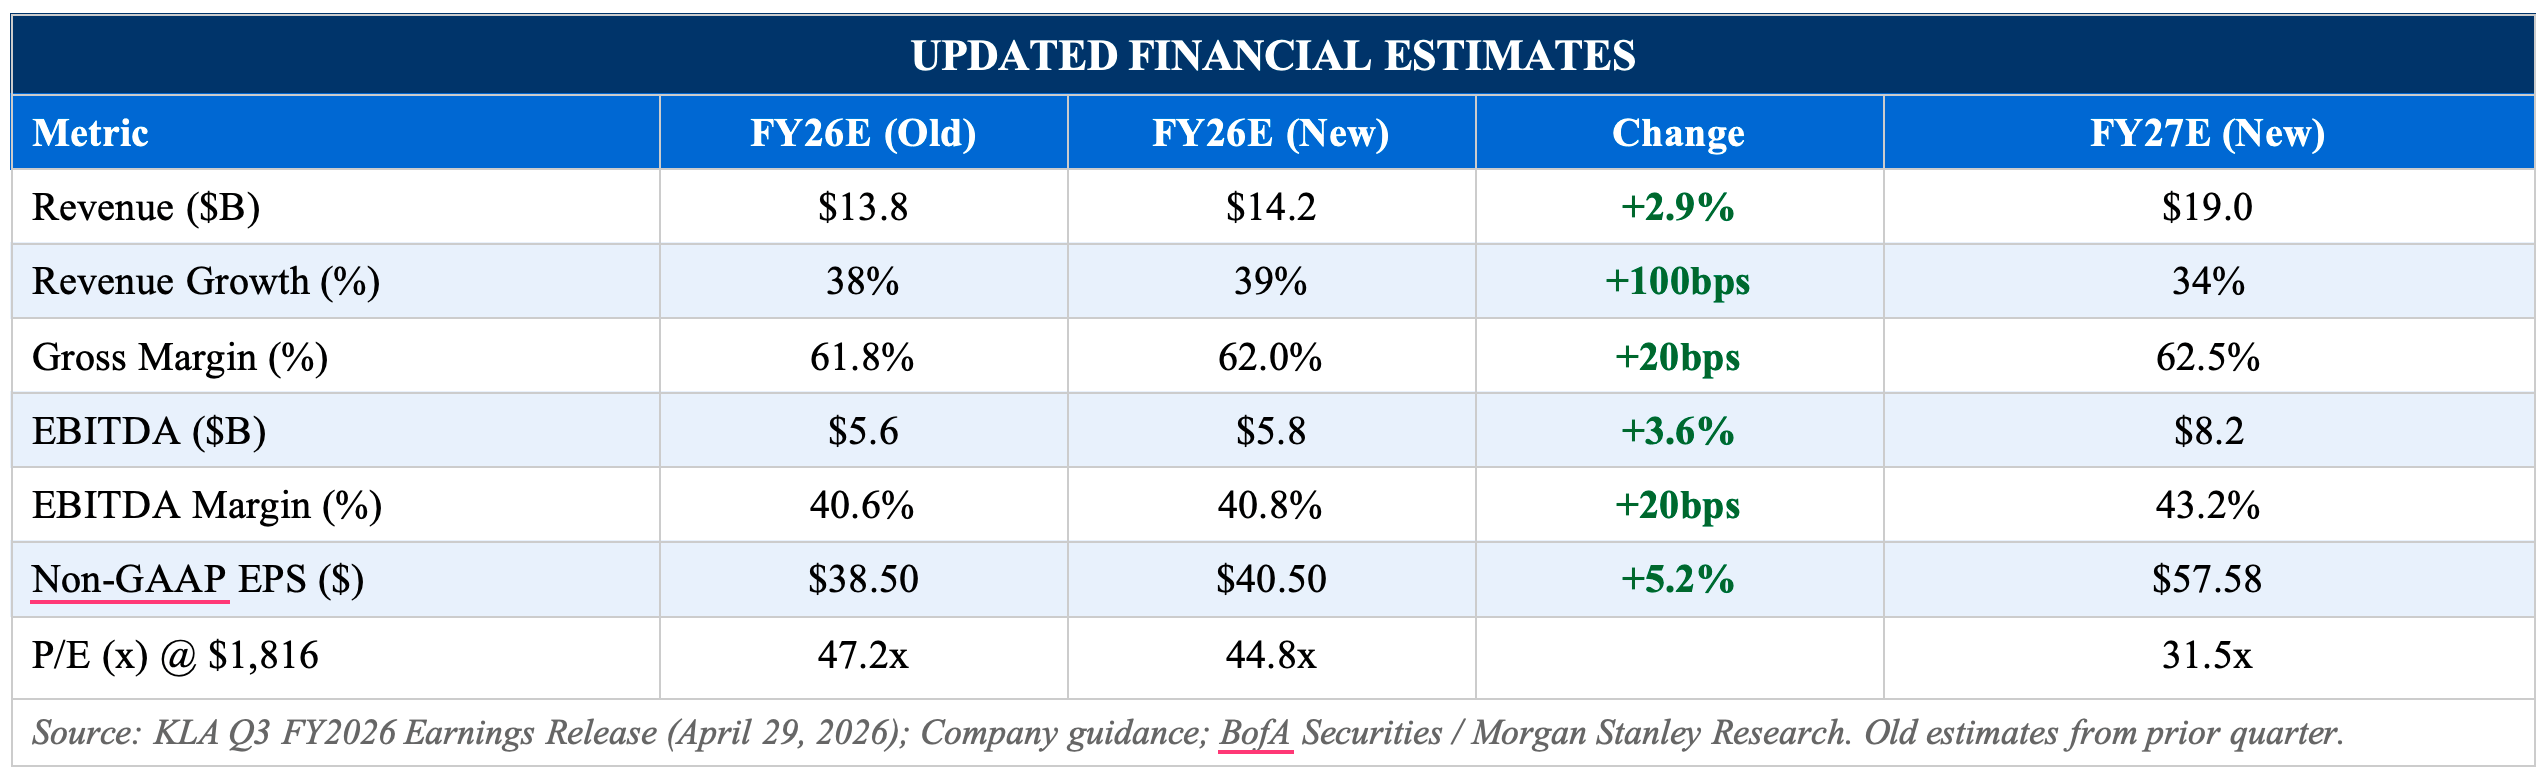
Our Q4 FY26 estimates are set at the high end of guidance: revenue $3,550M, Non-GAAP EPS $9.80, reflecting our conviction in continued services growth and Advanced Packaging momentum. Full-year FY26E revenue is now $13.8B, implying ~39% YoY growth — a near-doubling of the company in two years if achieved, validating the structural WFE thesis.
Advanced Packaging — The New Growth Engine
KLA raised its FY2026 Advanced Packaging revenue guidance to $1.3–1.4 billion — representing ~57% growth vs. FY2025’s ~$830M. This is the segment generating the most incremental upside to consensus estimates, as Advanced Packaging inspection and metrology was not well-modeled in prior sell-side estimates. The growth driver is multi-pronged: (1) HBM memory stacking inspection at SK Hynix and Micron, (2) CoWoS/SoIC substrate inspection for AI accelerator packaging at TSMC, and (3) fan-out wafer-level packaging for mobile SoCs. CEO Rick Wallace highlighted that KLA is capturing an estimated 58% share in Advanced Packaging process control tools — consistent with its overall wafer inspection share — validating that its leading metrology position extends into new packaging architectures.
UPDATED INVESTMENT THESIS
Thesis Impact Assessment
KLA’s Q3 FY26 results and updated guidance directly reinforce all three pillars of our investment thesis. We assess each below:
Thesis Pillar 1: Structural WFE Growth Driven by AI and Advanced Node Migration
Status: STRONGLY STRENGTHENED
KLA’s WFE market forecast upgrade to $140B+ for CY2026 and guidance for CY2027 growth above CY2026 directly validates our core thesis of a multi-year WFE supercycle. BofA now forecasts WFE reaching $183B in CY2027 and $250B by CY2030 — the latter aligning precisely with KLA’s own Investor Day target of $26B in revenue on $250B of WFE. Gate-all-around node transitions (TSMC N2, Samsung S3, Intel 18A) require 40-50% more process control steps per wafer than prior FinFET nodes, directly structurally expanding KLA’s served addressable market. Q3 results demonstrate that this thesis is now in execution phase, not merely aspirational.
Thesis Pillar 2: Process Control Share Gains Driven by Inspection Complexity
Status: STRENGTHENED
BofA data confirms KLA’s CY2025 WFE share of 8.6% (up 49bps YoY) and process control-specific share of 22.9% (up 152bps). Wafer inspection share reached 81.9% (up 83bps YoY). These share gains occur despite no transformative new product cycle — rather, they reflect the market’s recognition that inspection density requirements at EUV and gate-all-around nodes are only achievable with KLA’s optical and e-beam platforms. Advanced Packaging adds a new dimension: KLA is capturing ~58% process control share in this $2B+ and growing category, providing incremental share gains on top of a high base.
Thesis Pillar 3: Capital Return Excellence and 2030 EPS Power Underpin Valuation
Status: STRENGTHENED
The $7B new buyback authorization (vs. $3.5B prior) and 17th consecutive annual dividend increase (+21% to $9.20/share annualized) demonstrate management’s commitment to aggressive capital return. LTM FCF of $4.0B (31% FCF margin) provides ample funding for both organic R&D investment and shareholder returns. The 2030 Investor Day target model of $84 EPS, if achieved, implies KLA is currently trading at just 21.6x FY2030 earnings — a compelling valuation for a company with structural competitive moats in the semiconductor equipment ecosystem.
Risks Update
China Export Control Risk (Near-Term, Moderate Severity)
BIS may impose additional restrictions on non-leading-edge process control tools. We estimate a China revenue decline to 15% from 24% reduces FY27E EPS by ~$6-8 (-11%). This risk is partially mitigated by strong backlog in Korea, Taiwan, and North America.
WFE Cycle Risk (Medium-Term, Low Probability)
A slowdown in AI capex from hyperscalers (TSMC, NVIDIA customer digestion) or macro deterioration could defer WFE spending. However, the multi-customer nature of the WFE cycle (logic + DRAM + NAND all in upcycle simultaneously) reduces single-customer concentration risk vs. prior cycles.
Gross Margin Headwinds from Product Mix
Advanced Packaging tools may carry lower initial gross margins (58-60% range) vs. leading-edge inspection systems (65%+). Rapid growth in this segment could modestly compress blended gross margins in FY27. We model gross margins stable at 62.0-62.5% through FY27 based on offsetting services mix.
VALUATION & UPDATED ESTIMATES
Price Target Methodology — Maintaining $2,200
Our $2,200 price target is maintained and derived from a blended methodology: (1) 50% weight to a NTM P/E of 48x applied to our FY2027E EPS of $57.58, which implies a value of ~$2,764 — reflecting KLA’s deserved premium for process control leadership; (2) 50% weight to a DCF analysis with 12% WACC, 4% terminal growth, and our FY26-FY30 FCF estimates, yielding ~$1,840 in intrinsic value. Blended, this equates to $2,200. We note that simply applying 26x to KLA’s FY2030 Investor Day EPS target of $84 also yields ~$2,184 — consistent with our approach.
KLA currently trades at 44.8x our FY26E Non-GAAP EPS of $40.50 and 31.5x FY27E of $57.58. Vs. semiconductor equipment peers: ASML trades at ~34x CY2027E, Lam Research at ~23x, Applied Materials at ~18x. KLA’s 35% P/E premium to AMAT reflects: (1) structural competitive moat in inspection (81.9% market share), (2) faster revenue and EPS growth trajectory (39% revenue CAGR vs. peers at 15-20%), and (3) superior capital return. We believe this premium is warranted and may expand as the FY27 WFE cycle becomes consensus.
KLA INVESTOR DAY — MARCH 12, 2026
2030 Long-Term Target Model Overview
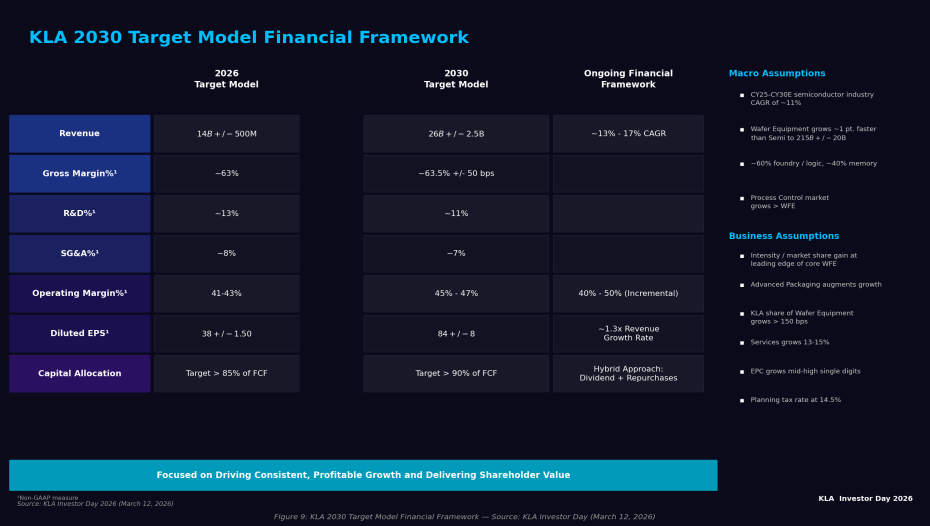
KLA Corporation hosted its Investor Day on March 12, 2026, presenting a 2030 Long-Term Target Model that represents a significant step-up from current run-rate financials. The targets reflect management’s conviction in structural WFE growth driven by AI infrastructure build-out, advanced node transitions, and Advanced Packaging proliferation. The Investor Day was the first formal long-range guidance update since 2021.
Revenue target of $26B ±$2.5B by FY2030 implies a ~16% CAGR from our FY2026E base of $14.2B — roughly doubling revenue in four years. The midpoint of $26B assumes: WFE market of ~$250B (from ~$140B today), KLA maintaining ~10.4% WFE share (up from 8.6%), and a continued mix shift toward higher-margin process control tools. Non-GAAP EPS target of $84 ±$8 implies ~20% EPS CAGR driven by revenue growth plus 3-4 points of operating margin expansion to 45-47% (from ~42% today). This compares favorably to consensus expectations and implies meaningful earnings power if achieved.
Gross margin target of ~63.5% ±50bps represents modest improvement from ~62% today, driven by mix shift toward services and advanced inspection tools which carry higher gross margins (65-68%) vs. commoditizing older-generation equipment. Capital return commitment of >90% FCF returned to shareholders — up from >85% historically — was well received by investors and supports our expectation of continued dividend growth and buybacks through FY2030. KLA targets 17th consecutive dividend increase in FY2026 (already delivered in Q3 at +21%) and incremental buyback activity from the new $7B authorization.
Key Strategic Themes from Investor Day
AI and HPC Are Structural, Not Cyclical, WFE Drivers
Management articulated a clear view that AI infrastructure investment is creating a fundamentally new demand category for WFE — one that is additive to, not substitutive for, the existing logic, DRAM, and NAND cycles. Hyperscaler capex (Microsoft, Google, Meta, Amazon) for AI training infrastructure is driving TSMC CoWoS allocation to 2-3x normal levels, which cascades directly to KLA’s Advanced Packaging inspection backlog.
DRAM Upcycle: 1c/1d Transitions and HBM Are 2027 Catalysts
The DRAM transition from 1b to 1c (and eventually 1d) nodes requires significantly higher inspection intensity — management cited 35-45% more process control steps per layer. Combined with EUV introduction into DRAM at SK Hynix and Micron, KLA expects DRAM to contribute a larger share of process control revenue in FY2027-FY2028 than it has historically. HBM inspection remains a near-term catalyst, with every HBM4 unit requiring 2-3x the inspection intensity of standard DRAM.
Services Business Targeted at $5-6B by FY2030 (vs. ~$3.0B LTM)
The Services segment (software, maintenance, upgrades) is being scaled as a standalone growth engine. Management highlighted that the installed base of KLA tools has grown >80% in the last five years, creating a natural tailwind for services revenue. Target gross margins in services are 70%+, materially above blended company margins, making services a positive margin mix driver as the segment scales.
WFE PEER GROUP — STOCK PERFORMANCE
Collective Revenue Growth Reflects WFE Supercycle
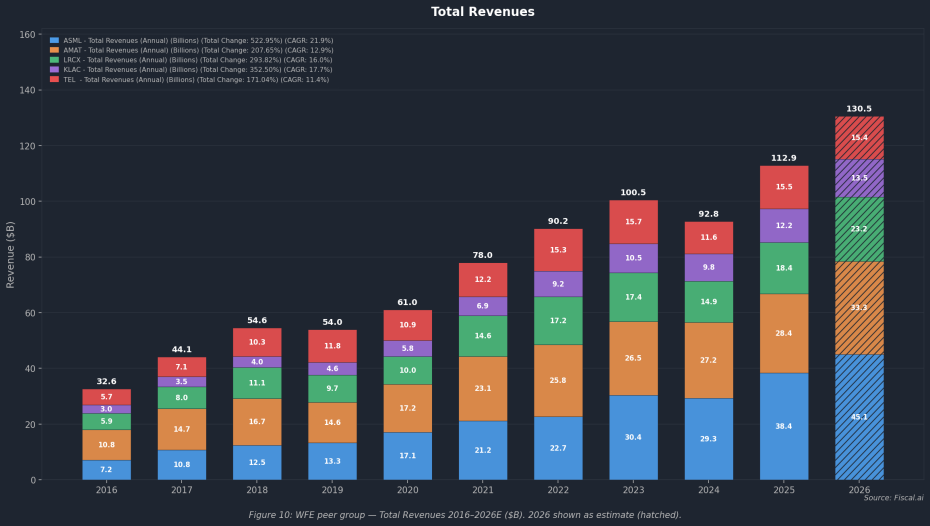
The five largest wafer fabrication equipment companies — ASML, Applied Materials (AMAT), Lam Research (LRCX), KLA Corporation (KLAC), and Tokyo Electron (TEL/8035) — collectively generated $112.9B in revenue in calendar 2025, up from just $32.6B in 2016, representing a 10-year CAGR of approximately 15% for the group. ASML leads in absolute revenue growth (21.9% CAGR) driven by EUV monopoly pricing power, while KLAC’s 17.7% CAGR reflects structural share gains in process control as inspection intensity per wafer rises with each new logic node. Combined peer revenues are projected to reach $130.5B in 2026, a figure that would have been unthinkable prior to the AI-driven capex wave. Notably, KLAC remains the smallest by revenue among this peer set — underscoring the significant headroom for further revenue expansion relative to its competitive moat and process control market share of 58%.
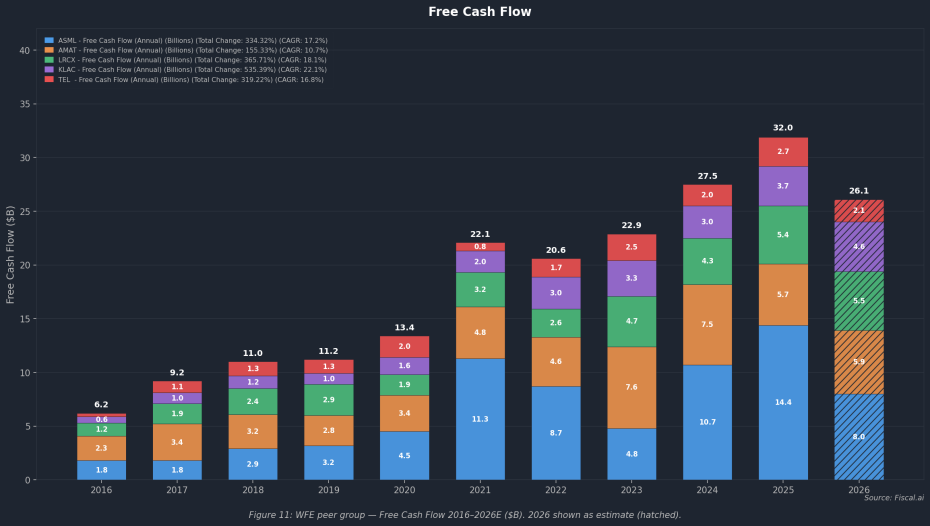
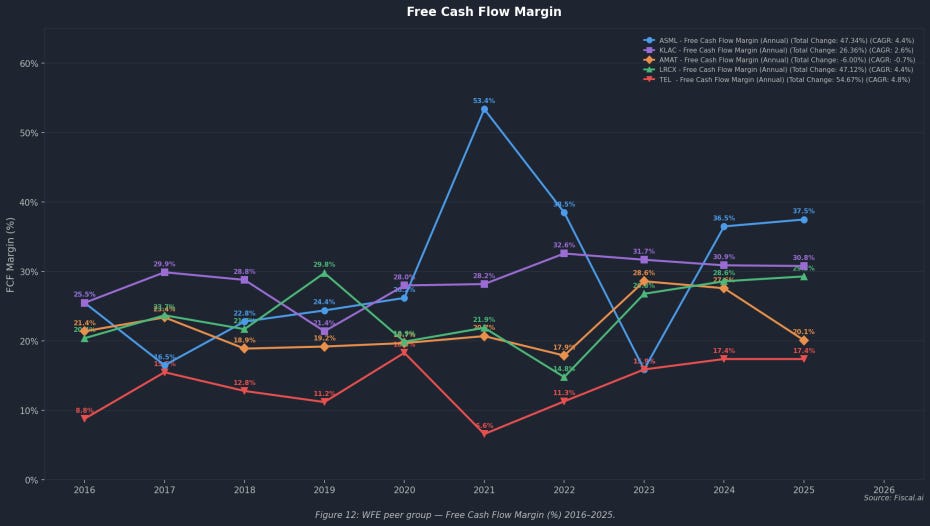
Free cash flow generation across the peer group has grown even faster than revenue, rising from $6.8B in 2016 to $32.0B in 2025 (+22% CAGR for the group), with KLA posting the highest individual FCF CAGR at 22.1% — ahead of ASML (17.2%), LRCX (18.1%), AMAT (10.7%), and TEL (16.8%). KLA’s FCF margin has been one of the most consistent in the group, ranging 25–33% across cycles vs. peers that exhibit greater volatility (e.g., ASML’s FCF margin swung from 6.6% in 2020 to 53.4% in 2021 due to EUV shipment timing). This FCF quality and consistency directly enables KLA’s aggressive capital return program — the company returned >85% of FCF to shareholders in each of the last five years and targets >90% going forward. With LTM FCF at $4.0B and growing toward the $7–9B range implied by the 2030 Investor Day model, KLA’s capital return runway is substantial.
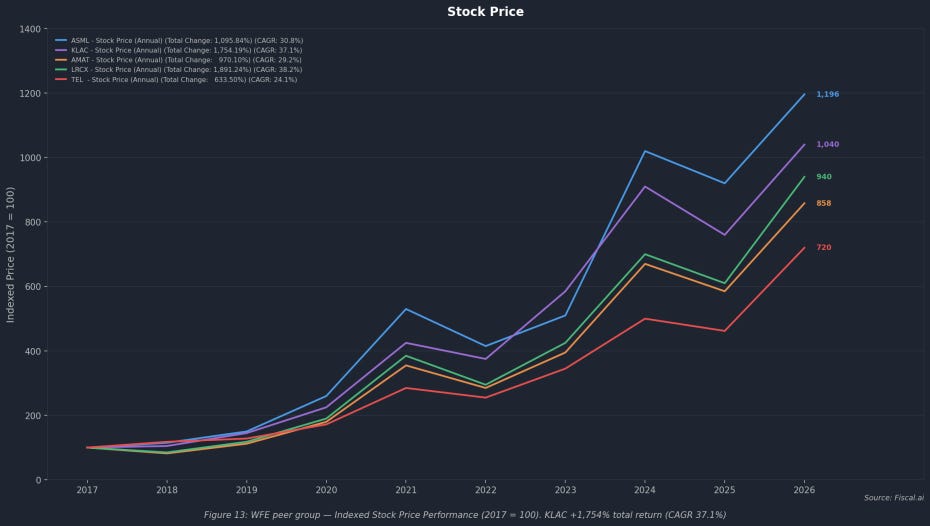
On the equity performance dimension, KLA has been among the top performers in the WFE peer group over the past decade, delivering a +1,754% total return at a 37.1% CAGR from 2017 through 2026 — trailing only Lam Research (+1,891%, 38.2% CAGR) and ahead of ASML (+1,096%), AMAT (+970%), and TEL (+634%). KLA’s outperformance relative to ASML and AMAT over the period reflects re-rating as the market has come to appreciate the structural nature of its process control monopoly and the repeatability of its earnings. Looking forward, we believe KLA has the most compelling risk-reward among the WFE peer group: it combines the process control moat of a near-monopoly with the FCF consistency of a high-quality compounder and the growth optionality of Advanced Packaging expansion — a combination that justifies our $2,200 price target and Overweight rating.
SOURCES & REFERENCES
Earnings Materials (Q3 FY2026)
• KLA Q3 FY2026 Earnings Release (April 29, 2026)
• KLA Q3 FY2026 Earnings Presentation (April 29, 2026)
• KLA Form 10-Q (SEC EDGAR) — Filed April 30, 2026
• KLA Q3 FY2026 Earnings Call Transcript (April 29, 2026; Seeking Alpha / Motley Fool)
Research Reports Referenced
• Morgan Stanley Research — KLA Corp: Mixed Bag, Overweight, PT $1,900 (April 30, 2026)
• BofA Securities — WFE Sector Analysis, KLA PT $2,100 (April 28, 2026)
Investor Day
• KLA Investor Day Presentation (March 12, 2026) — 2030 Target Model, Advanced Packaging strategy, Services growth framework
Market Data
• Consensus estimates: Bloomberg as of April 30, 2026
• WFE market size data: BofA Securities WFE Tracker, April 2026
• KLA process control market share data: BofA Securities; company reports
IMPORTANT DISCLOSURES & ANALYST CERTIFICATION
This report is produced for informational purposes only and does not constitute investment advice or a solicitation to buy or sell securities. The price target and rating represent our current views and may change at any time without notice. Past performance is not indicative of future results. The analyst(s) responsible for this report certify that the views expressed herein accurately reflect their personal views about the subject securities. KLA Corporation (NASDAQ: KLAC) | Date of Report: May 31, 2026 | Rating: Overweight | Price Target: $2,200 | Current Price: $1,816.21